|
Goldmining Reports Additional Infill Core Sampling at São Jorge Including Mineralized Saprolite at Surface Vancouver, British Columbia – November 24, 2021 – GoldMining Inc. (the "Company" or "GoldMining") (TSX: GOLD; NYSE American: GLDG) is pleased to announce additional infill assay results from an infill core sampling program at the São Jorge property. The initial phase of the program targets existing unsampled core intervals from previous drill programs at the 100% owned São Jorge property, located alongside regional highway BR-163 in the Tapajos region, Pará State, Brazil (see Figures 1-3 and Tables 1-3). Highlights:
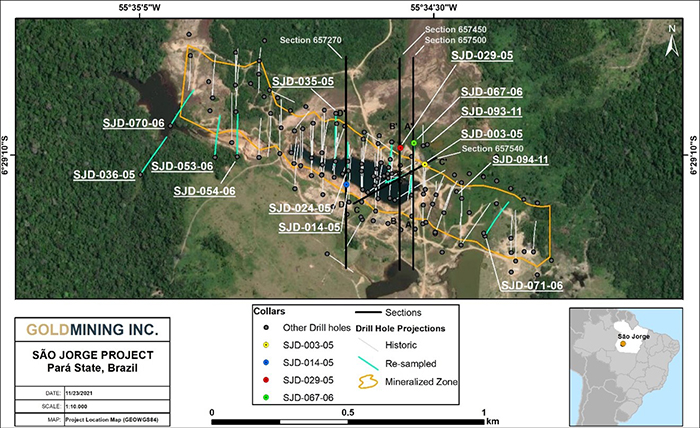
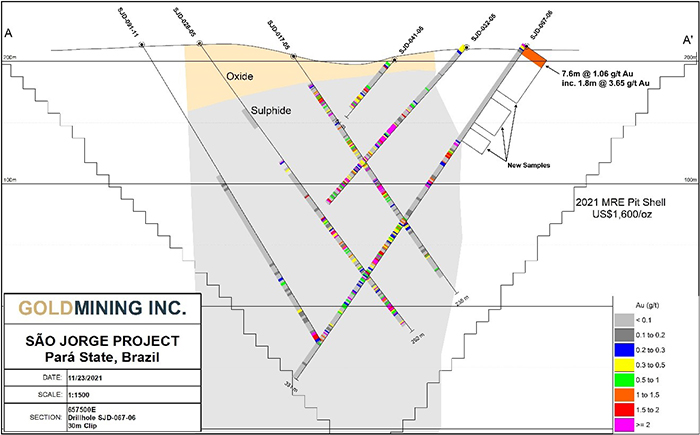
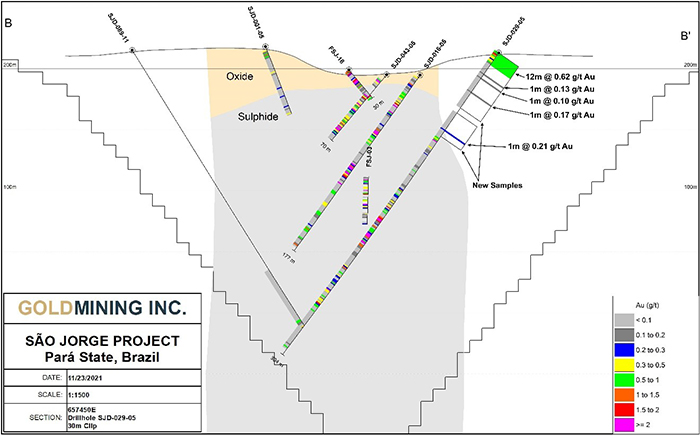
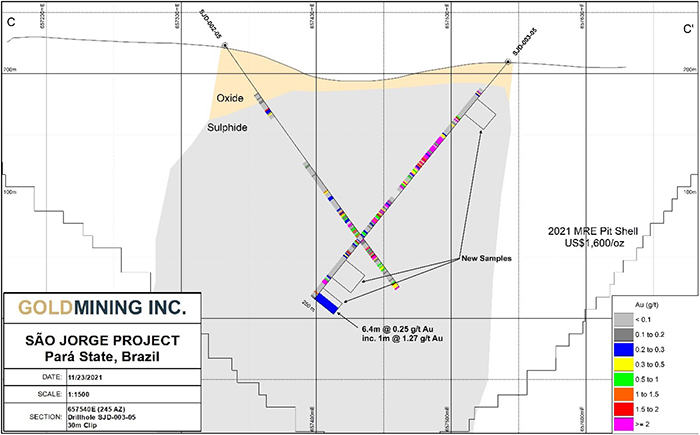
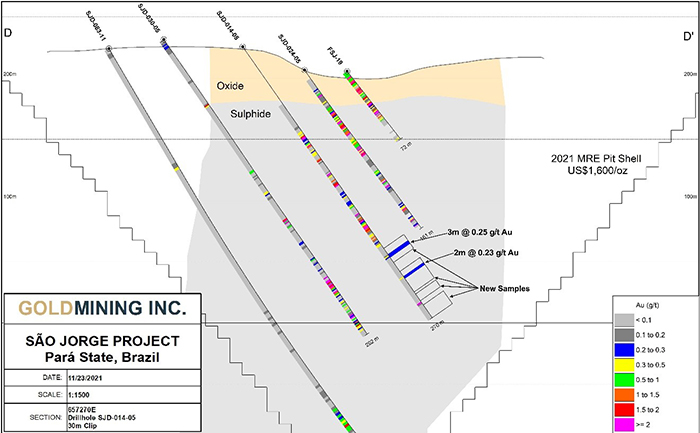
Alastair Still, CEO of GoldMining, commented: "This new information further demonstrates the potential of the São Jorge deposit which is located on an extensive 45,997 hectare land package easily accessible by state highway. These latest assay results from our infill sampling program confirm the presence of mineralized intervals of saprolite that were not only previously unsampled but importantly are located at surface and outside of any known mineralization or resource models. We are encouraged by the new information and will be reviewing opportunities to generate additional targets and expand the already exceptional potential of this large property.” GoldMining initiated a preliminary economic assessment ("PEA") at São Jorge on completion of its recently announced updated Mineral Resource estimate for the project (see June 1, 2021 news release). Part of the initial PEA work has identified opportunities to better define existing mineralization, as evident from this infill drill core sampling program. The assay results released today has improved our understanding of the current models and enhances our identification of new mineralized intervals to be tested. Table 1 lists all significant assay intervals from the first phase of infill sampling; Table 2 lists collar locations from holes with infill sampling; and Table 3 lists all intervals sampled in the infill sampling program. The results of the initial infill sampling program justify a follow-up phase of additional sampling. Figure 1 – Property location map showing the São Jorge deposit in Pará Sate. The 13 holes that contain intervals as part of the infill sampling program are shown with the light blue coloured drill traces. Results highlighted in this news release are taken along the four section lines shown in black and are presented in detail in Figures 2-5. Figure 2 – Section 657500 facing west shows sampling results near surface of Hole SJD-067-06 which includes interval 0.0-7.6m containing a mineralized interval of saprolite. Note that the mineralized interval occurs from surface and well outside the limits of our currently modeled mineralization (area shaded on section). Figure 3 – Section 657450 facing west shows sampling results near surface of Hole SJD-029-05 which includes interval 0.0-12.0m containing an interval of mineralized saprolite. Note that this mineralized interval similarly occurs well outside the limits of current modeled mineralization (area shaded on section). Figure 4 – Section 657540E facing northwest shows sampling results of Hole SJD-003-05 from interval 244-250.4m. Figure 5 – Section 657270 facing west showing new sampling at depth in Hole SJD-014-05 from interval 207.0-210.0m and 229.0-231.0m. Table 1 – Selected significant gold assay results from infill sampling of previously unsampled core. Mineralized intervals above 0.1 g/t Au are reported.
* Results previously reported October 4, 2021. Table 2 – Summary of gold assay results from previously unsampled core that comprise the first phase of the infill sampling program. Significant results are reported when there is an interval containing a sample grading above 0.10 g/t gold. Intervals showing NSV (no significant value) are reported when the interval does not contain a result exceeding 0.10 g/t gold.
* Results previously reported October 4, 2021. Table 3 – Collar coordinates from all holes that comprise the initial infill sampling program.
* Results previously reported October 4, 2021. All results are expressed as core length. There is insufficient work to estimate true thickness at this time. Qualified Person Paulo Pereira, P. Geo., President of GoldMining Inc. has supervised the preparation of, and approved, the scientific and technical information contained herein. Mr. Pereira supervised the sampling program and has verified the exploration information contained herein. Mr. Pereira is a Qualified Persons as defined in National Instrument 43-101. Data Verification For this program of drill core sampling, samples were taken from the NQ/HQ core by sawing the drill core in half, with one-half sent to SGS GEOSOL Labóratorios Ltda. ("SGS GEOSOL") and the other half retained for future reference. SGS GEOSOL is a certified commercial laboratory located in Vespasiano, Minas Gerais, Brazil. GoldMining has implemented a stringent quality assurance and quality-control (QA/QC) program for the sampling and analysis of drill core which includes insertion of duplicates, mineralized standards and blank samples for each batch of 100 samples. The gold analyses were completed by fire-assays with an atomic absorption finish on 50 grams of material. Repeats were carried out by fire-assay. About GoldMining Inc. GoldMining Inc. is a public mineral exploration company focused on the acquisition and development of gold assets in the Americas. Through its disciplined acquisition strategy, GoldMining now controls a diversified portfolio of resource-stage gold and gold-copper projects in Canada, U.S.A., Brazil, Colombia, and Peru. The Company also owns 20 million shares of Gold Royalty Corp. (NYSE American: GROY). For additional information, please contact: GoldMining Inc. Email: [email protected] Forward-looking Statements This document contains certain forward-looking statements that reflect the current views and/or expectations of GoldMining with respect to its expectations and ongoing and proposed work at the São Jorge property, future exploration and work programs and the expected PEA for the property. Forward-looking statements are based on the then-current expectations, beliefs, assumptions, estimates and forecasts about the business and the markets in which GoldMining operates. Investors are cautioned that all forward-looking statements involve risks and uncertainties, including: delays to plans caused by restrictions and other future impacts of COVID-19 or any other inability of the Company to meet expected timelines for planned project activities, including the timing of proposed PEA and work programs; the inherent risks involved in the exploration and development of mineral properties, fluctuating metal prices, proposed studies may not confirm GoldMining's expectations for its projects, unanticipated costs and expenses, risks related to government and environmental regulation, social, permitting and licensing matters, and uncertainties relating to the availability and costs of financing needed in the future. These risks, as well as others, including those set forth in GoldMiningꞌs Annual Information Form for the year ended November 30, 2020, and other filings with Canadian securities regulators and the U.S. Securities and Exchange Commission, could cause actual results and events to vary significantly. Accordingly, readers should not place undue reliance on forward-looking statements and information. There can be no assurance that forward-looking information, or the material factors or assumptions used to develop such forward-looking information, will prove to be accurate. The Company does not undertake any obligations to release publicly any revisions for updating any voluntary forward-looking statements, except as required by applicable securities law. |
