GoldMining Announces Updated PEA Highlighting $1.0 Billion After-Tax NPV and 32% IRR at La Mina Project, Colombia
Vancouver, British Columbia – April 28, 2026 – GoldMining Inc. (TSX: GOLD; NYSE American: GLDG) (the "Company" or "GoldMining") is pleased to announce the results of an updated preliminary economic assessment ("PEA") on the La Mina Project (the "Project"), located in Antioquia, Colombia.
All currency amounts herein are in US dollars unless otherwise indicated.
PEA Highlights1
- Enhanced Project Value: The updated PEA incorporates current bench-marked costs and updated base case pricing of $3,500 /oz gold (Au), $4.70/lb copper (Cu) and $40/oz silver (Ag), resulting in a 265% increase in after-tax net present value at 5% discount rate ("NPV5%") from the prior PEA disclosed by the Company for the Project.
- Strong Base Case Economics: After-tax NPV5% of $1.0 billion and an after-tax internal rate of return ("IRR") of 32.2% and initial payback of approximately 2.7 years.
- Leverage to Spot Prices: At current spot prices (approximately, $4,775/oz Au, $5.75/lb Cu, and $77/oz Ag), the after-tax NPV5% increases to approximately $1.8 billion with an IRR of 49.1% and initial payback of 1.9 years.
- High Capital Efficiency: Initial capital expenditures are estimated at $523 million, representing an attractive 0.5x initial capital to base case NPV5% ratio that highlights the Project’s potential for a compelling return on investment.
- Strong Production Profile: Average annual production of 152.4 koz Au equivalent ("AuEq") over the first five years of operation, and total life of mine ("LOM") production of 1.5 Moz AuEq (comprising 1.2 Moz Au, 2.6 Moz Ag, and 195 Mlbs Cu) over an 11.2 year projected mine life.
- Resilient Cost Profile: Estimated total cash cost of $872/oz Au and All-In Sustaining Cost ("AISC") of $1,045/oz Au (calculated on a by-product basis).
- Conventional Operation: The PEA contemplates a conventional open-pit truck-and-shovel operation and a processing rate of 15,000 tonnes per day ("tpd"). A proven processing flowsheet utilizing standard froth flotation and leach circuits achieves high metallurgical recoveries of 91% Au, 80% Cu, and 64% Ag.
- Significant Portfolio Potential: On a gold equivalent basis, the estimated mineral resources contained in the La Mina PEA account for approximately 9% of the Company’s global Measured and Indicated Resources and 16% of the Inferred Resources (refer to the Company’s Annual Information Form dated February 27, 2026).
Alastair Still, CEO of GoldMining commented, “The updated Project PEA highlights the underlying quality of the La Mina porphyry gold-copper mineral system and represents just a small portion of and emphasizes the depth of the GoldMining portfolio of projects that we continue to advance. By capturing current market consensus metals pricing, the PEA conceptualizes a robust $1.0 billion base case project that is characterized with an efficient capital intensity. We’re not simply adjusting for the higher commodity prices; we have confirmed that La Mina is potentially a resilient development opportunity. With these solid base case economics, which improve substantially at spot prices, the Company is excited by the opportunity to further advance and de-risk the Project on the path towards potential future development.”
1 The gold equivalent equations are: AuEq(oz) = Au (g/t) + [Cu(%) x {Cu Price/Au Price} x 22.0462 x 31.1035] + [Ag (g/t) x {Ag Price/Au Price}]. AISC includes mining costs, processing costs, royalties, G&A costs, transportation costs, sustaining capital and closure costs less by-product credits.
Table 1: Summary of La Mina PEA Production Metrics
| La Mina PEA Key Metrics | ||
| Production | Result | Units |
| Mine life | 11.2 | Years |
| LOM Strip ratio (waste:processed material) | 5.49 | Ratio |
| Total mined material | 398.4 | Mt |
| Total processed material | 61.3 | Mt |
| Nominal process plant rate | 15,000 | tpd |
| Gold Production | ||
| Average gold feed grade | 0.72 | g/t |
| Average gold metallurgical recovery | 91 | % |
| Total gold produced | 1,243.3 | koz |
Average annual gold production (Years 1-5) |
125.8 | koz |
| LOM | 107.7 | koz |
| Copper Production | ||
| Average copper feed grade | 0.19 | % |
| Average copper metallurgical recovery | 80 | % |
| Total copper production | 195.0 | Mlbs |
| Average annual copper production (Years 1-5) |
22.4 | Mlbs |
| LOM | 17.0 | Mlbs |
| Silver Production | ||
| Average silver feed grade | 2.36 | g/t |
| Average silver metallurgical recovery | 64 | % |
| Total silver production | 2,572.7 | koz |
Average annual silver production (Years 1-5) |
273.1 | koz |
| LOM | 248.6 | koz |
| Gold Equivalent Production1 | ||
| Average gold equivalent feed grade | 0.92 | g/t |
| Total gold equivalent produced | 1,534.6 | koz |
Average annual gold equivalent production (Years 1-5) |
152.4 | koz |
| LOM | 137.0 | koz |
Numbers may not add due to rounding.
(1) The gold equivalent equations are: AuEq(oz) = Au (g/t) + [Cu(%) x {Cu Price/Au Price} x 22.0462 x 31.1035] + [Ag (g/t) x {Ag Price/Au Price}]
The PEA is preliminary in nature, and there is no certainty that the reported results will be realized. The PEA includes Inferred Mineral Resources, which are considered too speculative geologically to have the economic considerations applied to them that would enable them to be categorized as Mineral Reserves. There is no certainty that this PEA, including the conceptual economics set out therein, will be realized.
Table 2: Summary of La Mina PEA Financial Metrics
| La Mina PEA Key Financial Metrics | ||
| Metal Prices | Base Case | Spot Price |
| Gold ($/oz) | 3,500 | 4,775 |
| Copper ($/lb) | 4.70 | 5.75 |
| Silver ($/oz) | 40 | 77 |
| Operating Costs (OPEX) | Result | Units |
| Mining unit cost | 1.94 12.62 |
$/t mined $/t milled |
| Process unit cost | 14.90 | $/t milled |
| General and Administrative (G&A) unit cost | 0.66 | $/t milled |
| Off-site operating cost | 1.32 | $/t milled |
| Total OPEX | 29.50 | $/t milled |
| Total Cash cost (by-product basis) 1 | 872 | $/oz Au |
| AISC (by-product basis) 2 | 1,045 | $/oz Au |
| Capital Expenditures (CAPEX) | Result | Units |
| Initial capital expenditure (includes pre-strip) | 523.3 | $M |
| Sustaining capital expenditure | 166.0 | $M |
| Closure costs | 49.8 | $M |
| Total Capital | 739.1 | $M |
| Base Case Economics | Result | Units |
| Net present value (NPV5%) – pre-tax | 1,613.9 | $M |
| Internal rate of return (IRR) – pre-tax | 45.2% | % |
| Net present value (NPV5%) – after-tax | 1,001.5 | $M |
| Internal rate of return (IRR) – after-tax | 32.2 | % |
| Payback – after-tax | 2.7 | Years |
| Spot Price Economics | Result | Units |
| Net present value (NPV5%) – pre-tax | 2,848.7 | $M |
| Internal rate of return (IRR) – pre-tax | 68.7% | % |
| NPV5% – after-tax | 1,804.1 | $M |
| IRR – after-tax | 49.1 | % |
| Payback – after-tax | 1.9 | Years |
Numbers may not add due to rounding.
(1) Total Cash Costs consist of mining costs, processing costs, royalties, general administrative, and transportation costs, less by-product credits.
(2) AISC includes Total Cash Costs plus sustaining capital and closure costs, less by-product credits.
Base Case assumes $3,500/oz Au, $4.70/lb Cu, and $40/oz Ag.
Spot Price assumes $4,775/oz Au, $5.75/lb Cu, and $77/oz Ag.
La Mina PEA Summary
The PEA reviewed and refined mine engineering design work completed during the previous (2023) preliminary economic assessment disclosed by the Company, including updating all operating and capital cost estimates following a comprehensive review of technical inputs, and updating metal price assumptions. No other substantive changes were made during the study.
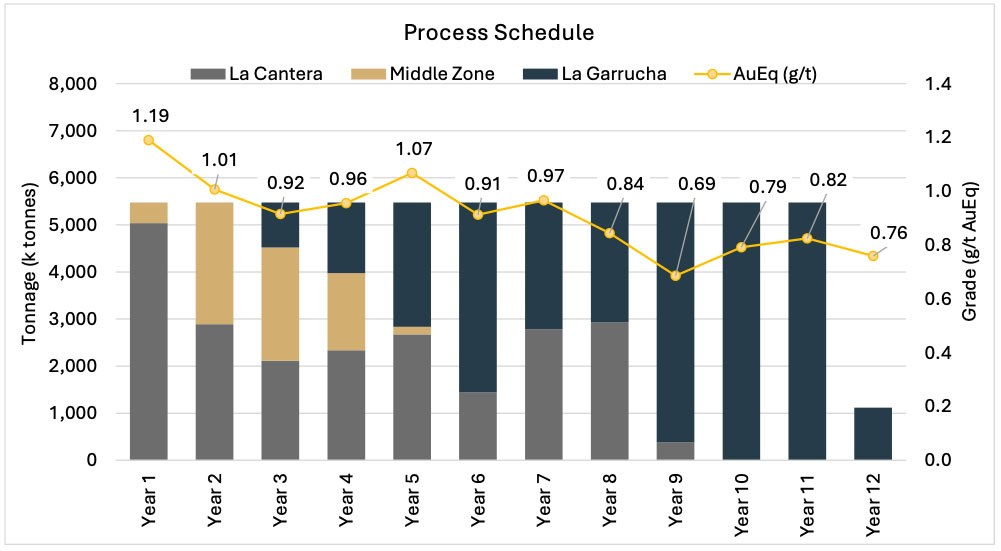
The Project, covering 3,208 hectares, is located in the Department of Antioquia, Republic of Colombia, approximately 51 km southwest of Medellin. The Mineral Resource Estimate ("MRE") for La Mina includes the La Cantera, La Garrucha, and Middle Zone porphyry deposits, which are located within 1,000 meters of each other. No additional drilling has been completed at La Mina in support of this updated PEA, therefore the current MRE with effective date December 20th, 2022, remains current in support of the PEA.
The PEA considers a conventional drill, blast, load, and haul open pit operation mining an average of 97,000 tpd over the 11.2 year life of mine. It contemplates that resources will be processed at a nominal rate of 15,000 tpd by conventional grinding and flotation to generate a copper concentrate, with tailings of the copper process reporting to a leach circuit to generate gold-silver doré on site. The combined LOM average metallurgical recovery of 91%, 80% and 64% are realized for gold, copper and silver, respectively.
The PEA includes on-site development including mining, haul roads, access roads, process facilities, tailings and waste storage facilities, and related ancillary facilities. Construction is anticipated to take approximately two years with an initial capital expenditure of $523.3 million with operations continuing for 11.2 years. Sustaining capital expenditures over the LOM are expected to be approximately $166 million, consisting of a mix of mining capital equipment and staged expansion of the tailings and waste facilities. LOM operating costs are expected to average $29.50/t of material processed.
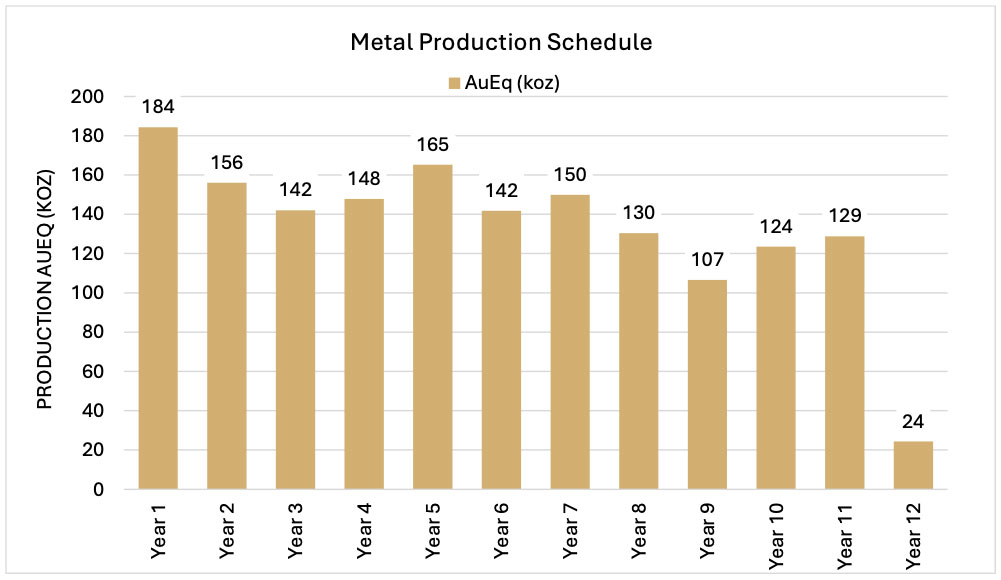
Under the PEA, highest metal production occurs in the initial five years of production averaging 152.4 koz AuEq comprising 126 koz Au, 22.4 Mlbs Cu, and 273 koz Ag annual production. Year 1 production of 176.5 koz AuEq comprises 138 koz Au, 27.0 Mlbs Cu, and 174.8 koz Ag. LOM average production is 137.0 koz AuEq, comprising 107.7 koz Au, 17.0 Mlbs Cu, and 248.6 koz Ag.
The LOM average mining rate in the PEA is 5.5 Mt resources per annum and 30.1 Mt waste, which equates to an average LOM strip ratio of 5.5:1.
Table 3: Capital Breakdown
| Initial ($M) | Sustaining ($M) | Total ($M) | |
| Contractor Pre-Strip | 11.4 | 46.4 | 57.9 |
| Mining Equipment | 80.5 | 81.2 | 161.8 |
| Process Plant | 224.7 | 5.0 | 229.7 |
| Site | 65.0 | - | 65.0 |
| Tailing Storage Facility Initial | 6.0 | 5.6 | 11.6 |
| Owner's Cost | 58.1 | - | 58.1 |
| Contingency | 77.5 | 27.7 | 105.2 |
| Sub-total Capital | 523.3 | 166.0 | 689.3 |
| Mine Closure | 49.8 | 49.8 | |
| Total Capital | 523.3 | 215.7 | 739.1 |
Numbers may not add due to rounding
Figure 1: Metal Production Schedule
The gold equivalent equations are: AuEq(oz) = Au (g/t) + [Cu(%) x {Cu Price/Au Price} x 22.0462 x 31.1035] + [Ag (g/t) x {Ag Price/Au Price}]
Figure 2: Process Schedule
The gold equivalent equations are: AuEq(oz) = Au (g/t) + [Cu(%) x {Cu Price/Au Price} x 22.0462 x 31.1035] + [Ag (g/t) x {Ag Price/Au Price}]
Mineral Resource Estimate
The PEA is based on the Mineral Resource estimate set forth in the Company’s previous technical report titled "NI 43-101 Technical Report and Preliminary Economic Assessment For The La Mina Project, Antioquia, Republic of Colombia" dated effective July 24, 2023. There has been no material change in such Mineral Resource estimate for the Project. For the purpose of this PEA, such was reviewed by the Qualified Person under the PEA and deemed to remain valid and effective.
TABLE 4: Pit Constrained Mineral Resource Estimate (Effective Date: December 20, 2022)
| Grades | Contained Metal | ||||||||
| Deposit | Tonnes | Au | Ag | Cu | AuEq | Au | Ag | Cu | AuEq |
| (kt) | (g/t) | (g/t) | (%) | (g/t) | (koz) | (koz) | (Mlbs) | (koz) | |
| Indicated Mineral Resource | |||||||||
| La Cantera | 17,614 | 0.86 | 2.03 | 0.31 | 1.32 | 487 | 1,150 | 120 | 753 |
| La Garrucha | 7,358 | 0.65 | 3.14 | 0.11 | 0.84 | 154 | 743 | 18 | 201 |
| Middle Zone | 8,800 | 0.54 | 1.28 | 0.11 | 0.71 | 153 | 362 | 21 | 201 |
| Total Indicated | 33,772 | 0.73 | 2.08 | 0.21 | 1.06 | 794 | 2,255 | 159 | 1,150 |
| Inferred Mineral Resource | |||||||||
| La Cantera | 11,175 | 0.71 | 1.85 | 0.30 | 1.15 | 255 | 665 | 73 | 413 |
| La Garrucha | 44,107 | 0.55 | 2.46 | 0.10 | 0.72 | 780 | 3,488 | 97 | 1,020 |
| Middle Zone | 949 | 0.47 | 1.15 | 0.09 | 0.61 | 14 | 35 | 2 | 19 |
| Total Inferred | 56,231 | 0.58 | 2.32 | 0.14 | 0.80 | 1,049 | 4,188 | 171 | 1,454 |
Notes:
- The qualified person for the above estimate is Scott Wilson, C.P.G, SME.
- Mineral Resources are classified as Indicated Resources and Inferred Resources and are based on the 2014 CIM Definition Standards. The estimation of Indicated Mineral Resources involves greater uncertainty as to their existence and economic feasibility than the estimation of Mineral Reserves, and therefore investors are cautioned not to assume that all or any part of Indicated Mineral Resources will ever be converted into Mineral Reserves. The estimation of Inferred Mineral Resources involves greater uncertainty as to their existence and economic viability than the estimation of other categories of Mineral Resources.
- Numbers may not add up due to rounding.
- Cut-Off Grade: 0.30 g/t Au.
- The Mineral Resource Estimate was based on US$ metal prices of $3.50/lb Cu, $1,700/oz Au and $21/oz Ag.
- Gold-equivalent grades were calculated using the following formula: AuEq = Au (g/t) + [Cu(%) x {Cu Price/Au Price} x 22.0462 x 31.1035] + [Ag (g/t) x {Ag Price/Au Price}].
- The quantity and grade of reported Inferred Mineral Resources in this estimation are uncertain in nature and there has been insufficient exploration to define these Inferred Mineral Resources as Indicated or Measured Mineral Resources.
- There are no known environmental, permitting, legal, title, taxation, socio-economic, marketing, political or other relevant factors that may materially affect the Mineral Resource Estimate.
For a description of the data verification, assay procedures and the quality assurance program and quality control measures applied by the Company, please see the Company’s Annual Information Form for the year ended November 30, 2025, filed under the Company’s profile on SEDAR+ at www.sedarplus.ca. Further information about the PEA referenced in this news release, including information in respect of data verification, key assumptions, parameters, risks and other factors, will be contained in a technical report, which will be filed by the Company in respect of the PEA within 45 days under its profile at SEDAR+ at www.sedarplus.ca.
Opportunities
This new PEA highlights strong potential for the advancement of the Project and sets out several opportunities for future study which may further enhance project value, including:
| Opportunity | Potential Benefits |
| Infill Drilling | Increase confidence in the geological models and controls on and interpolation of grade; may increase resource grade overall and convert mineral resources to higher categories. |
| Exploration Drilling | Expansion opportunities at the existing deposits to delineate additional resources. |
| Exploration drilling outside of the current resources | Porphyry cluster model predicts potential for new porphyry discoveries within the existing La Mina district-scale land package. |
| Metallurgical test work & Process design | Variability test work to optimize process flowsheet and improve gold, copper, and silver recoveries. |
| Geotechnical test work | Optimize pit wall slopes and potentially reduce strip ratio and to assess potential waste rock and tailings storage sites. |
| Infrastructure design & Scheduling | Optimize site layout, material handling and pit backfill to reduce LOM operating costs. |
| Environmental & Sustainability Governance (ESG) | Environmental baseline & heritage studies, and community stakeholder engagement to inform the local community about the potential mining opportunity and economic benefits. |
Qualified Persons
The PEA was prepared for the Company by Scott E. Wilson, CPG, Zeke Blakeley, SME-RM, and Rick Jordan, SME-RM, each of which is independent of the Company and a Qualified Person, as such term is defined in NI 43-101. The specific sections of the technical report for which each such Qualified Person is responsible will be set out in the technical report relating to the PEA. Each such Qualified Person has reviewed and approved the scientific and technical information regarding the PEA as disclosed in this news release.
Imola Götz, M.Sc. P.Eng., F.E.C., Vice President, Project Development of the Company and a Qualified Person, as such term is defined in NI 43-101, has supervised the preparation of this news release and has reviewed and approved the scientific and technical information contained herein.
About GoldMining Inc.
GoldMining Inc. is a public mineral exploration company focused on acquiring and developing gold assets in the Americas. Through its disciplined acquisition strategy, GoldMining now controls a diversified portfolio of resource-stage gold and gold-copper projects in Canada, the U.S.A., Brazil, Colombia, and Peru.
For additional information, please contact:
Martin Dumont
VP, Corporate Development & Investor Relations
Telephone: (855) 630-1001
Email: [email protected]
Notice to Readers
Disclosure regarding the Project, including the PEA and Mineral Resource estimates included herein, has been prepared by the Company in accordance with NI 43-101. NI 43-101 is a rule developed by the Canadian Securities Administrators that establishes standards for public disclosure by issuer of scientific and technical information concerning mineral projects. NI 43-101 differs significantly from the disclosure requirements of the United States Securities and Exchange Commission ("SEC") generally applicable to U.S. companies subject to the SEC's disclosure requirements. For example, the terms "Indicated Mineral Resource" and "Inferred Mineral Resource" are defined in NI 43-101 by reference to the guidelines set out in the CIM Definition Standards on Mineral Resources and Mineral Reserves. Accordingly, information contained herein or in the Company's descriptions of its projects may not be comparable to similar information made public by U.S. companies reporting pursuant to SEC disclosure requirements.
Investors are cautioned not to assume that all or any part of "Measured" or "Indicated" Mineral Resource will ever be converted into "reserves". Investors should also understand that "Inferred Mineral Resources" have a great amount of uncertainty as to their existence and great uncertainty as to their economic and legal feasibility. Under Canadian rules, estimated "Inferred Mineral Resources" may not form the basis of feasibility or pre-feasibility studies except in rare cases.
For further information regarding the Company's projects and the resource estimates disclosed herein, please refer to the Company's most recent Annual Information Form and the technical reports filed under the Company's profile at www.sedarplus.ca and www.sec.gov.
Forward-Looking Statements
Certain of the information contained in this news release constitutes "forward-looking information" and "forward-looking statements" within the meaning of applicable Canadian and U.S. securities laws ("forward-looking statements"), which involve known and unknown risks, uncertainties and other factors that may cause the Company’s actual results, performance and achievements to be materially different from the results, performance or achievements expressed or implied therein. Forward-looking statements, which are all statements other than statements of historical fact, include, but are not limited to the results of the PEA, the Company’s plans and expectations regarding future opportunities and proposed work at the Project and the Company’s other plans and expectations regarding the Project. Forward-looking statements are based on the then-current expectations, beliefs, assumptions, estimates and forecasts about the business and the markets in which GoldMining operates. Investors are cautioned that all forward-looking statements involve risks and uncertainties, including: the inherent risks involved in the exploration and development of mineral properties, fluctuating metal prices, unanticipated costs and expenses, risks related to government and environmental regulation, social, permitting and licensing matters, and uncertainties relating to the availability and costs of financing needed in the future. These risks, as well as others, including those set forth in GoldMiningꞌs Annual Information Form for the year ended November 30, 2025, and other filings with Canadian securities regulators and the SEC, could cause actual results and events to vary significantly. Accordingly, readers should not place undue reliance on forward-looking statements. There can be no assurance that forward-looking statements, or the material factors or assumptions used to develop such forward-looking statements, will prove to be accurate. The Company does not undertake to update any forward-looking statements, except in accordance with applicable securities law.